%201.svg)


HIPAA Compliance Checklist for 2025

By 2026, non-human identities such as APIs, bots, IoT devices, and third-party integrations will outnumber human users by more than 3 to 1. Yet most organizations still lack a formal inventory of their machine identities.
At the same time, 80% of cyberattacks now exploit compromised identities, according to the Verizon DBIR 2025.
Identity is no longer just an authentication layer. It is the control plane of enterprise security.
In today’s security-driven environment, Identity and Access Management metrics are not vanity numbers. They are leading indicators of breach risk, operational inefficiency, and compliance exposure.
In this guide, you will learn:
- The essential IAM metrics every security team should track
- The difference between performance and risk metrics
- Benchmarks and target ranges
- How machine identity metrics change the equation
- How to align IAM metrics with Zero Trust
TL;DR
- Identity and access management metrics help track security performance, compliance, and user efficiency.
- Key metrics include authentication success rate, provisioning time, and compliance rate.
- Monitoring these metrics reduces breaches, speeds onboarding, and boosts productivity.
- Regular analysis ensures IAM systems align with business goals and regulations.
- CloudEagle.ai simplifies IAM tracking, reporting, and optimization for better security outcomes.
1. How to Measure Identity Risk Correctly?
Identity and Access Management metrics are measurable indicators that evaluate how effectively your organization:
- Authenticates users
- Grants and restricts access
- Enforces least privilege
- Detects identity misuse
- Maintains compliance
Without structured IAM metrics, identity governance becomes reactive. You only find gaps after an audit or breach.
Organizations that consistently track identity and access management metrics gain:
- Early warning signals for credential abuse
- Faster onboarding and secure offboarding
- Reduced orphaned accounts
- Measurable compliance readiness
- Clear visibility into access sprawl
The goal is not to collect more data. The goal is to track the right metrics that influence security posture and operational performance.
This is how RingCentral reclaimed unused licenses
2. What Is the Difference Between a KPI and a KRI in Identity and Access Management?
In IAM, all metrics are not equal.
A KPI (Key Performance Indicator) measures performance against a defined goal.
A KRI (Key Risk Indicator) measures exposure to security or compliance risk.
Many IAM programs confuse the two.
Understanding the difference changes behavior.
- KPIs help you optimize operations.
- KRIs help you prevent breaches.
Both are necessary. But KRIs often deserve executive visibility.
3. The Essential IAM Metrics Every Enterprise Should Track
IAM metrics should be tracked across areas like user authentication, authorization, identity lifecycle management, security, and user experience.
The right identity management metrics not only tell you what’s happening in your system, but they also guide proactive decision-making, uncover hidden risks, and highlight opportunities to improve both security and user experience.
Here are the key areas you should monitor:
a. Access Lifecycle Metrics
These metrics track the full journey of a user’s access, from the moment they join the organization to when their account is deactivated. Incomplete or delayed lifecycle actions are a major cause of security gaps.
Why track it:
- Onboarding speed: Measures how quickly new hires receive the right access without delays.
- Offboarding efficiency: Tracks how fast access is revoked when someone leaves, reducing the risk of unauthorized use.
- Role change accuracy: Ensures access rights align with evolving responsibilities, preventing privilege creep.
b. Authentication Performance Metrics
Authentication is the frontline of security. Tracking these IAM metrics helps you understand whether your login and verification processes are both secure and user-friendly.
Why track it:
- Success vs. failure rates: A high failure rate may indicate usability issues or attempted brute-force attacks.
- Multi-factor authentication adoption: Measures how many users comply with MFA policies.
- Authentication time: Tracks how long it takes for a user to log in, which can impact productivity.
c. Authorization Outcome Metrics
Authorization defines who gets access to what after authentication. These identity management metrics ensure access requests are evaluated and granted according to policy.
Why track it:
- Grant vs. denial rates: Spot unusual patterns in approvals or rejections.
- Access review frequency: Tracks how often permissions are reassessed to maintain least privilege.
- Policy compliance rate: Ensures access aligns with regulatory and internal security policies.
d. User Experience Metrics
Security shouldn’t come at the expense of usability. Monitoring the end-user impact of IAM processes ensures employees can work efficiently without resorting to risky shortcuts.
Why track it:
- Help desk tickets: Identify recurring IAM-related issues like password resets or account lockouts.
- Satisfaction scores: Measure user perception of the IAM system.
- Login friction: Track unnecessary authentication prompts that could hinder productivity.
e. Incident Detection & Response Metrics
These metrics connect identity events to potential security threats. When suspicious activity is tied to specific accounts, it’s easier to investigate and contain.
Why track it:
- Identity-related incidents detected: Count events like privilege escalation, anomalous login locations, or multiple failed attempts.
- Time to detect (TTD): Measures how quickly your system identifies identity misuse.
- Time to respond (TTR): Tracks how fast your team takes corrective action once an incident is spotted.

4. What Are Machine Identity Metrics and Why Are They Your Biggest IAM Blind Spot?
When most organizations track IAM metrics, they focus entirely on human users. That’s risky because machine identities generate far more access activity in modern cloud environments.
When most organizations track IAM metrics, they focus entirely on human users. But in modern cloud and SaaS environments, machines, APIs, bots, microservices, IoT devices, CI/CD pipelines, and third-party integrations generate far more access activity than humans do. And they're far less monitored.
1. Total Machine Identity Inventory
What it measures: The total count of non-human identities in your environment, service accounts, API keys, certificates, bot accounts, and secrets, and whether each has a documented owner.
Target: 100% of machine identities should have a named human owner. Any machine identity without an owner is effectively an orphaned account at scale.
2. Credential Rotation Rate for Machine Identities
What it measures: The percentage of machine identity credentials (API keys, service account passwords, certificates) being rotated within their defined rotation policy.
Formula: (Machine credentials rotated on schedule ÷ Total machine credentials requiring rotation) × 100
Target: 100%. Credentials not rotated on schedule create persistent access windows that attackers can exploit after an initial compromise.
3. Credential Age Distribution
What it measures: How long each machine identity credential has been active without rotation. Credentials active for 90+ days without rotation should be treated as a critical risk.
Target: No API key, service account password, or certificate should be older than 90 days in production systems. Flag certificates at 30 days before expiry.
5. Why Tracking IAM Metrics Reduces Risk and Cost
Tracking Identity and Access Management metrics delivers key benefits like stronger security, greater operational efficiency, cost reduction, and improved compliance.
Monitoring these metrics helps organizations detect risks early, refine processes, and make smarter resource allocation decisions.
Improved Security Posture
Monitoring identity metrics like failed login attempts, privilege escalations, and incident frequency gives you early warning signs of potential threats.
Why it matters:
- Detect anomalies early: Spot suspicious access attempts before they escalate into breaches.
- Reduce attack surface: Identify and eliminate orphaned accounts or unused privileges that hackers could exploit.
- Improve incident response: Real-time alerts tied to identity management metrics allow faster containment and remediation.
Streamlined User Experience
Identity and access management metrics, such as authentication success rate, help you gauge how easily users can access the resources they need.
Why it matters:
- Boost productivity: Minimize login issues that slow down employees.
- Reduce frustration: Ensure secure access without excessive hurdles, like unnecessary MFA prompts.
- Encourage adoption: Well-optimized IAM systems promote legitimate use instead of insecure workarounds.
Compliance Readiness
Maintaining accurate and up-to-date identity management metrics is crucial for demonstrating compliance with regulations such as GDPR, HIPAA, SOX, or PCI DSS.
Why it matters:
- Audit preparedness: Quickly produce evidence of policy enforcement during inspections.
- Regulatory alignment: Follow best practices for identity and access management metrics to avoid penalties.
- Risk reduction: Compliance often overlaps with security, helping you mitigate legal and reputational risks.
Operational Efficiency
Tracking IAM metrics like onboarding timelines, offboarding efficiency, and password reset trends allows you to identify inefficiencies that slow down IT and HR processes.
Why it matters:
- Faster onboarding: Enable new hires to be productive on day one.
- Immediate offboarding: Remove access for departing employees instantly to close security gaps.
- Lower IT workload: Reduce help desk tickets with self-service tools and automation.
Read how Bloom & Wild automated onboarding and offboarding - Read More
6. How IAM Tools Improve Your IAM Metrics?
Identity and Access Management tools play a vital role in achieving key organizational metrics by boosting security, enhancing operational efficiency, and lowering costs.
They simplify user access management, enforce security policies, and offer detailed audit trails, positively influencing performance, as noted by leading security and IT resources.
Automated Reporting
The first metric that matters is audit defensibility.
CloudEagle automatically maintains detailed, time-stamped logs for:
- Access grants and revocations
- Role changes
- Privileged access approvals
- Just-in-time access events
- Policy exceptions
This directly improves:
- Compliance rate
- Access review completion rate
- Time to produce audit evidence
- Privileged access governance score
Instead of manually exporting spreadsheets during SOC 2 or ISO 27001 audits, your team can generate audit-ready reports instantly. IAM metrics become provable, not theoretical.
Automated Onboarding and Offboarding
Manual provisioning is where IAM metrics quietly break down.
CloudEagle automates:
- Role-based onboarding based on department or function
- Instant deprovisioning across connected apps
- Removal of dormant or orphaned accounts
This improves:
- Provisioning time
- Offboarding SLA compliance
- Orphaned account rate
- Least privilege adherence
Faster lifecycle execution reduces standing access risk and closes the gap attackers exploit.
Just-in-Time Access and Privilege Control
Standing privilege is one of the biggest drivers of identity risk.
CloudEagle’s just-in-time access ensures users receive elevated permissions only when needed and only for a defined duration.
This directly impacts:
- Privileged account growth rate
- Lateral movement risk score
- Privileged access duration metrics
- KRI indicators tied to attack surface expansion
Access automatically expires. No manual cleanup required
Automated App Access Requests
IAM friction creates shadow IT. Shadow IT destroys metrics.
CloudEagle’s automated app access request workflows:
- Route approvals through predefined governance chains
- Enforce least privilege before granting access
- Maintain complete approval audit trails
This improves:
- Access request turnaround time
- Unauthorized access risk
- Help desk IAM ticket volume
- Policy compliance rate
Governance becomes structured instead of reactive.
500+ Integrations for Unified Identity Visibility
IAM metrics break down when identity data is fragmented.
CloudEagle integrates with:
- Okta, Azure AD, and other identity providers
- HRIS systems
- Security tools and SIEM platforms
- ITSM systems like ServiceNow
- 500+ SaaS applications
This enables:
- Unified identity inventory
- Cross-system access correlation
- Centralized visibility of user and machine access
- Accurate machine identity tracking
Without integrations, IAM metrics are partial. With integrations, they are complete.
The Bottom Line
IAM metrics improve when identity governance is automated, auditable, and integrated across your stack.
CloudEagle doesn’t just measure identity performance. It operationalizes it.
Measure and Strengthen Access Control


7. How Do IAM Metrics Align With Zero Trust Security in 2026?
Zero Trust is no longer a future framework. It is becoming the default IAM operating model for forward-thinking enterprises. The core principle of Zero Trust, never trust, always verify, demands a new class of identity metrics that go beyond traditional binary pass/fail measurements.
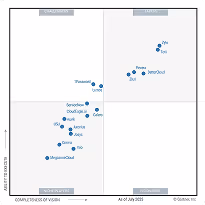
In 2026, Gartner highlights an evolution toward outcome-driven IAM metrics tied directly to Zero Trust maturity and organizational resilience. CISOs now prioritize adaptive authentication success rates and privileged access governance scores to justify budgets and demonstrate ROI.
Watch: Why 60% of SaaS & AI apps operate off IT radar (webinar)
Watch now?
8. Final Thoughts
Measuring and tracking the right identity and access management metrics is no longer optional; it’s essential for security, compliance, and operational efficiency. By monitoring KPIs like authentication success rates, provisioning times, and compliance rates, you gain the clarity needed to strengthen your IAM strategy.
CloudEagle.ai empowers enterprises to take control of their identity and access management metrics with automated reporting, compliance tracking, and actionable insights. From reducing IAM security incident frequency to improving user satisfaction.
Book a free demo with CloudEagle.ai today and see how better IAM metrics can transform your security posture.
Frequently Asked Questions
1. What is a good authentication success rate benchmark?
A healthy authentication success rate is 95% or higher. Below 90% may signal MFA friction, misconfigurations, or attack attempts. Consistently above 99% can indicate overly permissive controls. The right benchmark balances security with user experience.
2. What is Segregation of Duties (SoD) in IAM, and why does it matter?
Segregation of Duties prevents one user from holding conflicting permissions, such as creating and approving transactions. SoD violations create fraud and compliance risks and are common audit findings under SOX, PCI DSS, and HIPAA.
3. How often should access certifications be conducted?
Privileged access should be reviewed monthly or quarterly. Sensitive system access should be reviewed quarterly. General access can be reviewed semi-annually or annually. Third-party access should be reviewed monthly or immediately upon contract termination.
4. What is the difference between IAM and PAM metrics?
IAM metrics track all identities and lifecycle events, including provisioning and access reviews. PAM metrics focus on privileged accounts, tracking admin access, vaulting, session monitoring, and just-in-time privileges. PAM is a subset of IAM but requires stricter oversight.
5. What are machine identity metrics, and why track them?
Machine identity metrics track service accounts, API keys, certificates, and bots. Key indicators include inventory coverage, credential age, rotation compliance, and ownership. Unmanaged machine credentials are a growing supply chain and breach risk.


.avif)


.avif)
.avif)


.png)